KUSS Service Management
Turning a spreadsheet-driven scent service operation into a connected field-service system: what to do, where to go, what to bring, and what happened after the visit.
- CLIENT
- KUSS Essentials (3Essentials Sdn Bhd)
- STUDIO
- Bravonet Solution
- ROLE
- Product designer: UX, IA, wireframes, UI
- TIMELINE
- May – July 2026
01
TL;DR
The problem
Service ran on spreadsheets and manual coordination. Technicians pieced each visit together from several sources.
The opportunity
One connected source for schedules, sites, devices, preparation and status.
My role
UX and wireframes for the technician app, plus the admin panel and customer portal around it.
The result
A task-based service app and the system behind it, covering the whole visit from planning to the record the customer sees.
02
The business
The customer experiences the scent. Behind it is a recurring service operation.
KUSS, based in Puchong, Selangor, scents hotels, offices and commercial spaces. Devices like the KIT and Tube-X are installed on site and kept running on a monthly subscription, so every device needs a technician to visit, refill and maintain it on schedule.
THE SERVICE LIFECYCLE
- Device installed
- Visit scheduled
- Task assigned
- Materials prepared
- Travel
- Service
- Completed
- Records updated
- Next visit
03
The problem
The service was running. The system around it wasn't.
Spreadsheets and coordination kept it going, but the effort sat with people. Not a crisis, just friction that grows with every new site.
Schedule fragmentation
Working out the day meant scanning a sheet by hand.
Preparation uncertainty
Formulas and items weren't attached to the job.
Information switching
Customer, site and device details lived apart.
Status visibility
The office couldn't easily see what was done.
Field dependency
All of it was needed on the move, away from a desk.
HOW A VISIT CAME TOGETHER BEFORE
- Excel schedule
- Manual coordination
- Scan the sheet
- Look up location
- Check preparation
- Find device details
- Travel
- Update status by hand
04
The people
Three groups, one service, different slices of it.
Field service staff
The primary user. Needs today's jobs, the route, what to prepare and site details, on a phone, between places.
Admin / operations
Schedules and assigns jobs, manages clients, devices, stock and crews, and needs to see what's done.
Business customer
Wants upcoming visits, what was done, and a way to give feedback or get in touch.
05
Research
No big research study. A close read of how the operation actually works.
Workflow audit
How a job moves from office to technician and back.
Spreadsheet analysis
Which fields the operation relies on for every visit.
Stakeholder questions
Rules the sheet doesn't show: postponing, missing items, returns.
Domain research
Devices, oils, formulas and refill cycles.
Journey mapping
What's needed at each moment of a visit.
Pattern review
How field-service tools handle tasks, states and dispatch.
BEFORE THE VISIT
- Who creates and assigns a job?
- What's needed before leaving?
- Where does prep info live?
ON SITE
- What's needed on arrival?
- What if the customer is out?
- What if an item is missing?
AFTER
- How is completion recorded?
- What happens to unused stock?
- What should the customer see?
06
What we learned
Five findings shaped everything after.
A job is a workspace
A visit carries a site, hours, a contact, devices and prep. So the job card had to hold all of it.
Work starts at packing
So preparation belongs inside the workflow, not in a separate sheet.
Arrival needs context
Address, hours and who to call, one tap from the task.
Status is the product
Upcoming, active, completed, postponed: visible to everyone.
Built for the field
Quick glances on a phone while driving, packing or at a machine.
Findings come from workflow analysis and design hypotheses, not a formal study.
07
Framing the problem
How might we turn a spreadsheet-driven service operation into a connected workflow that gives technicians the right information at the right moment, and gives operations visibility across the whole lifecycle?
User goal
Finish visits accurately with as little searching as possible.
Business goal
See the operation clearly, with room to grow.
System goal
Connect schedules, sites, devices, stock and records.
08
Information architecture
It was never one app. It was a connected operational system.
Three roles share the same records. Admin creates them, the technician app acts on them, and the customer portal reads a simpler view.
ADMIN PANEL
- Users and roles
- Service crews
- Clients and branches
- Service routes
- Devices
- Stock and suppliers
- EO volume log
- Packing list
- News
TECHNICIAN APP
- Home and route
- Service task
- View more info
- Packing list
- Post service form
- Stock return
- News
CUSTOMER PORTAL
- Upcoming services
- Completed services
- Service report
- Feedback
- Contact
- Account
09
The service journey
Eight stages, from a job being created to the record the customer sees.
| Stage | What happens | Design response |
|---|---|---|
| Created | Admin schedules a route | Jobs built from the client's branches and devices |
| Assigned | Technician gets it | Shows up on Home and in Service Task |
| Preparation | Oils and parts packed | Packing list with formula, quantity, Mark As Prepared |
| Travel | Technician heads out | Waze and Maps on every job card |
| Arrival | At the site | View More Info: hours, contact, devices, notes |
| Service | Device serviced | Device details and prep items per device |
| Completion | Visit recorded | Post service form, photo, services performed |
| Follow-up | Records update | Stock return, history, customer report and feedback |
10
Design principles
Task first
Always show what happens next.
Context at the right moment
What this step needs now, the rest one tap away.
One source of truth
Everything hangs off the service task.
Design for the field
For someone moving between sites, not at a desk.
11
Home
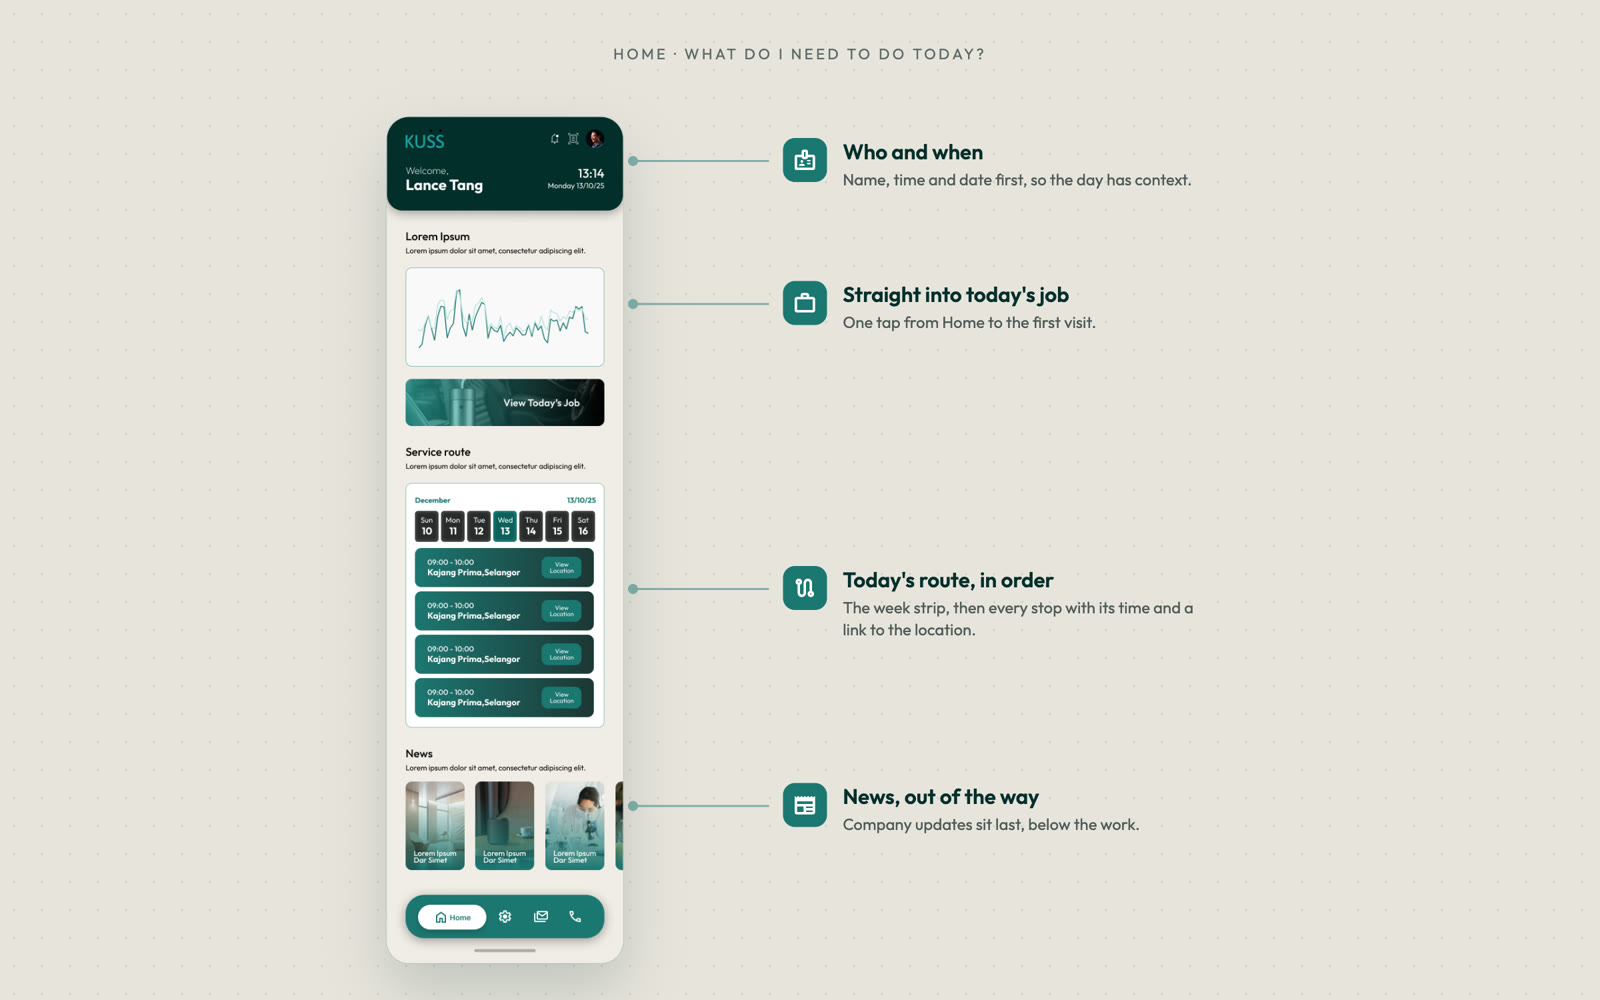
What do I need to do today?
Home answers one question. Name and time, a shortcut to today's job, then the route in order. A technician's day is shaped by travel, so the route comes before any single job's details.
12
Service task
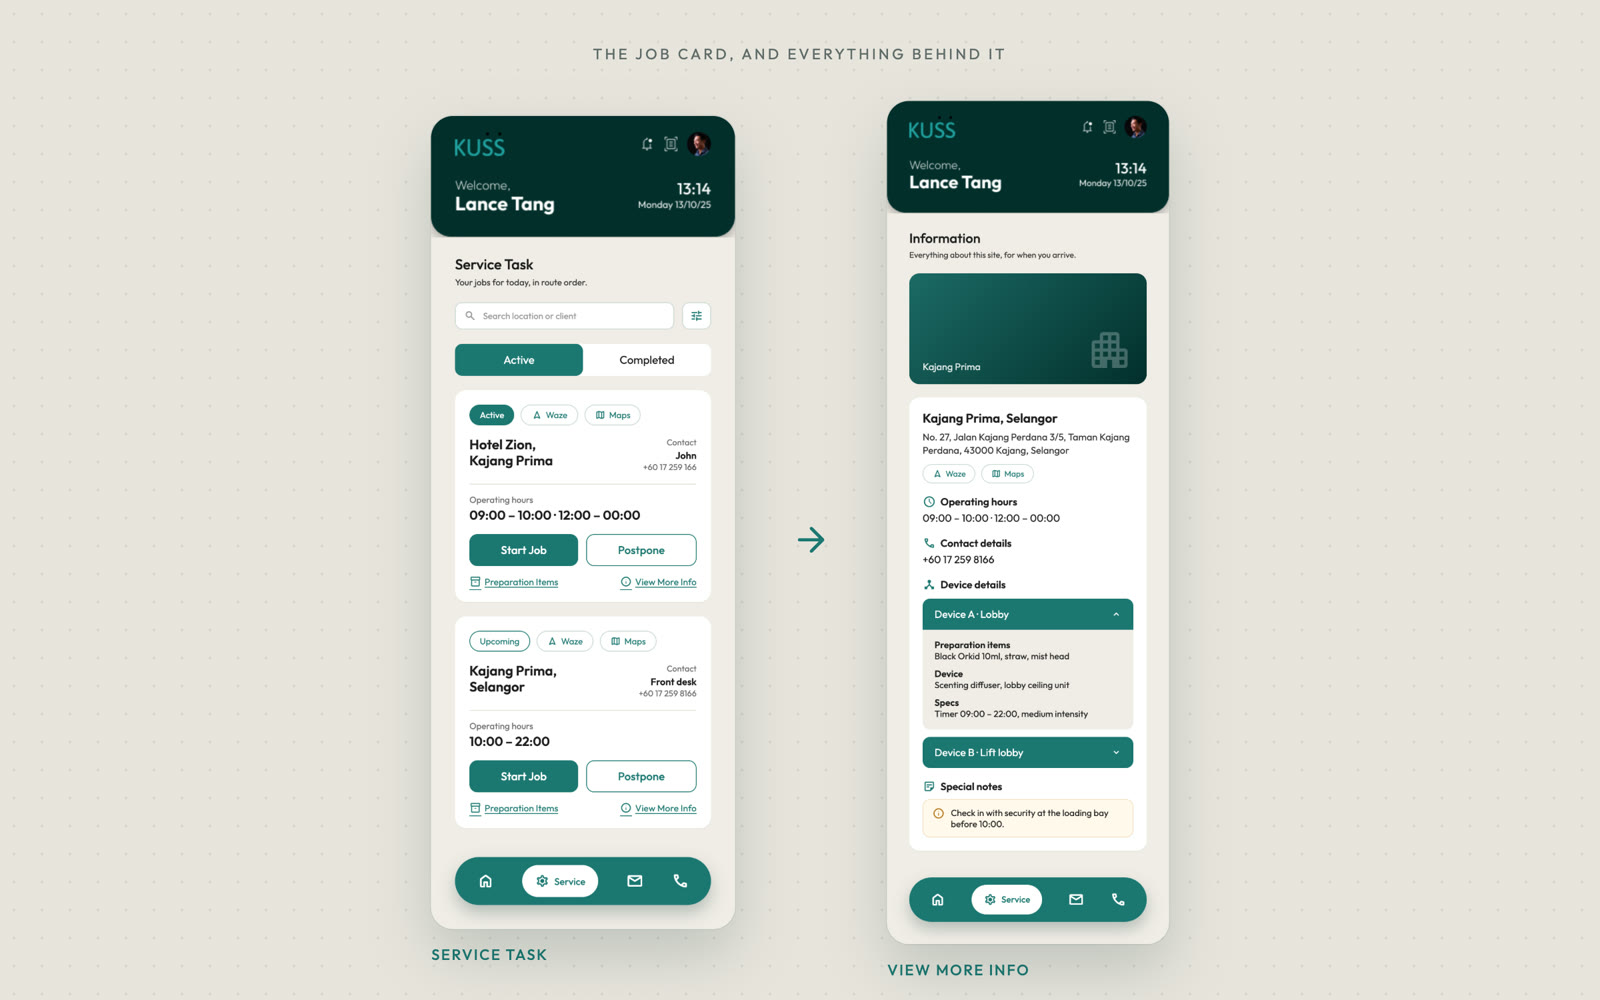
The job card is where a visit comes together.
Status, site, contact, hours, Waze and Maps on one card, with Start Job, Postpone, Preparation Items and View More Info. The job becomes the unit of context, so nothing needs looking up elsewhere.
BEFORE
- Excel
- Chat
- Maps
- Notes
- Sheet
AFTER
- Service task
- Location
- Preparation
- Devices
13
At the door
Location context is operational data, not a contact card.
| The question | Where it's answered |
|---|---|
| Where exactly? | Address, Waze and Maps |
| Can I go in now? | Operating hours |
| Who do I contact? | Contact details |
| Which device? | Device details and specs |
| What did I bring for it? | Preparation items per device |
| Anything unusual? | Special notes |
14
Packing list
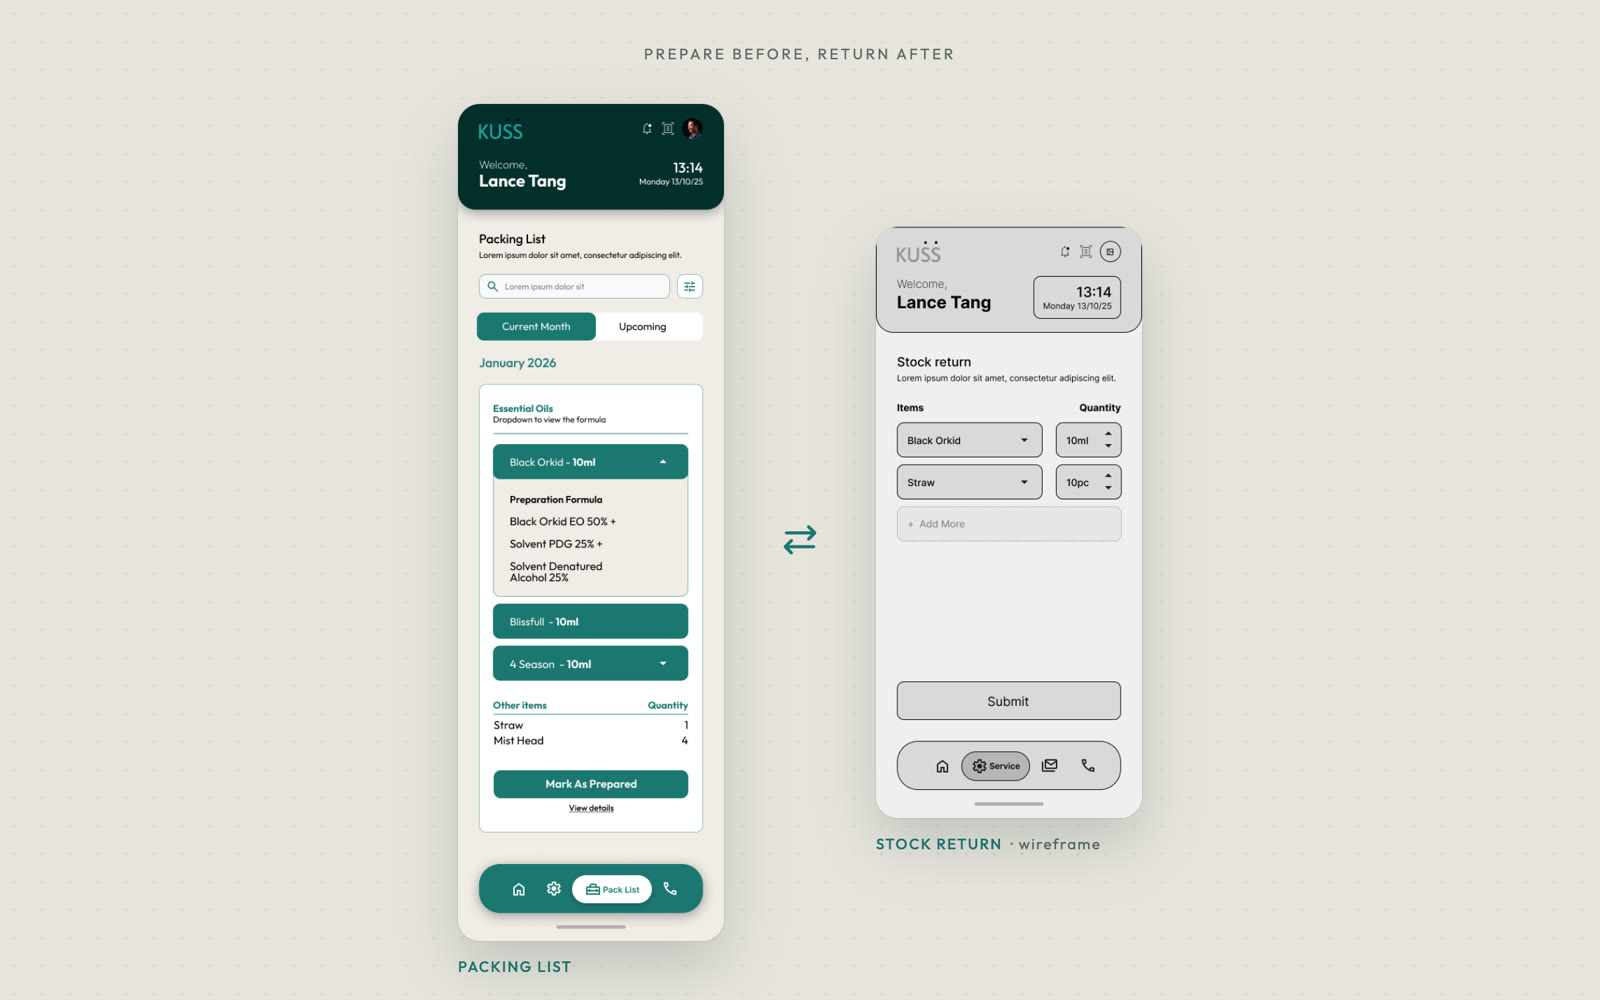
Not "go to Hotel Zion". "Go to Hotel Zion with exactly what this machine needs."
Each oil comes with its formula (Black Orkid 10ml is 50% essential oil, 25% PDG, 25% denatured alcohol) plus straws and mist heads. Mark As Prepared is a simple yes or no on purpose: quick at the packing table and a clear signal to the office.
Preparation has a second half. Whatever isn't used goes back through Stock Return, so the office's stock and oil logs stay accurate.
- Service task
- Scent
- Formula
- Quantity
- Prepared
- Unused stock returned
15
Closing the visit
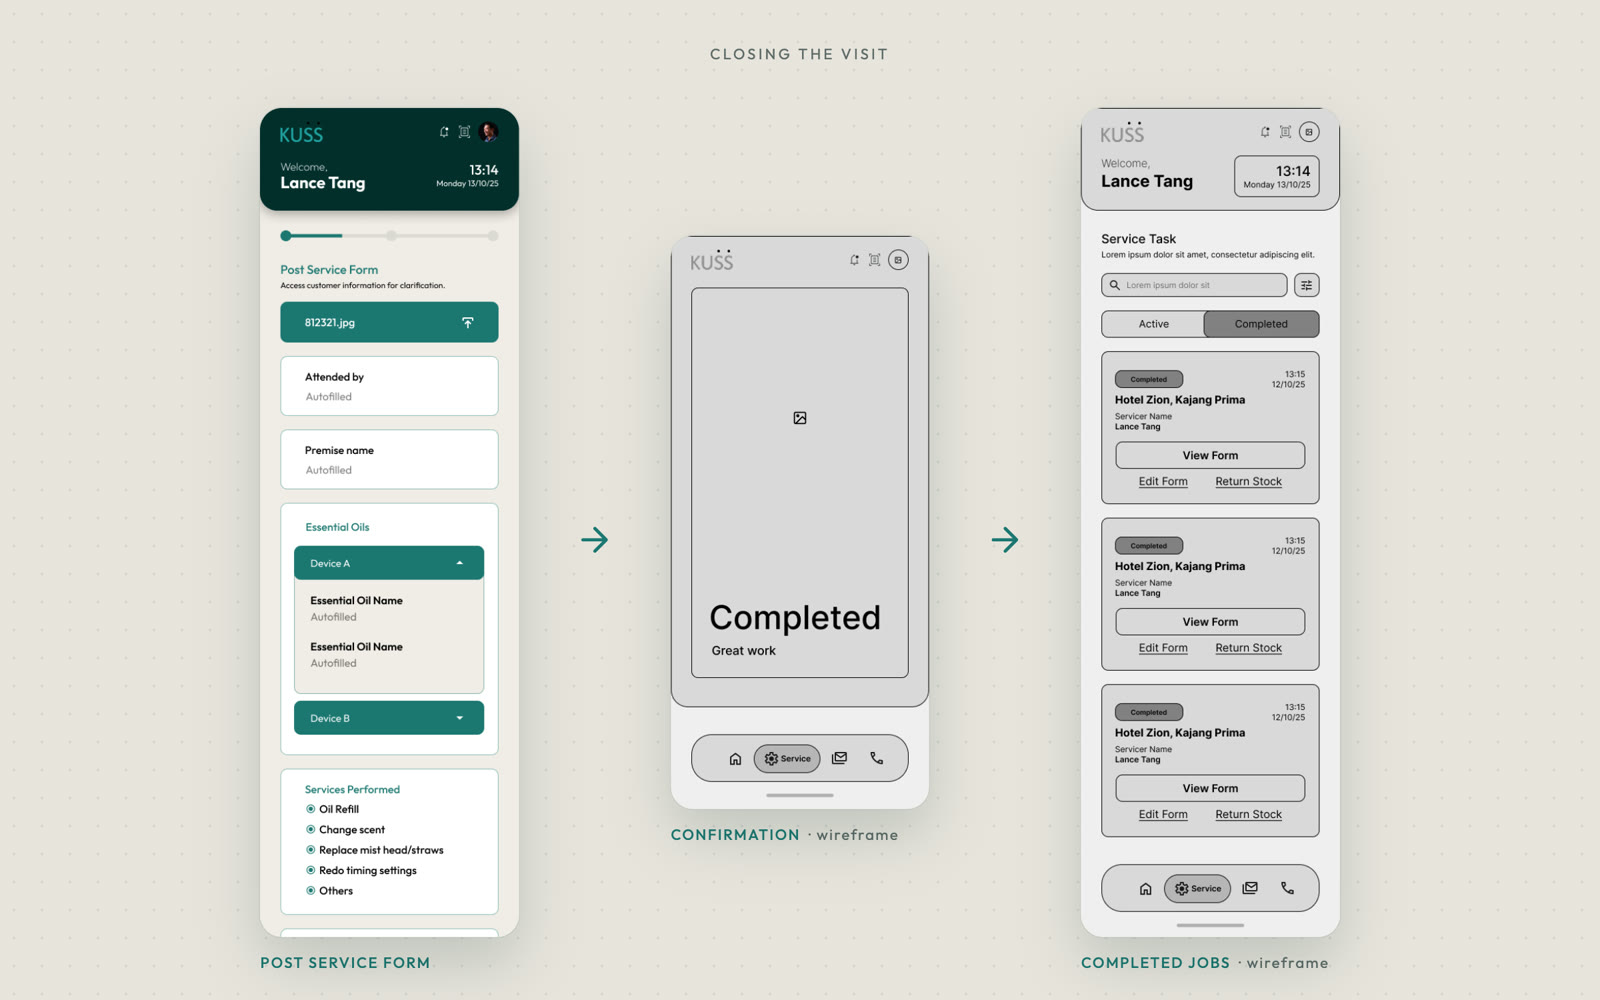
A visit isn't done when the technician leaves. It's done when it's recorded.
The post service form autofills who attended, the premise and each device's oil, so the technician only adds what's new: an after photo, the services performed (oil refill, scent change, mist head or straw replacement, timing) and remarks. A confirmation follows, and the job moves to Completed with the form and Return Stock attached.
16
States and edge cases
A UI that only works on the happy path breaks on the first postponed visit.
I mapped states early so every screen knew what to show. The edge cases were considered in the system design. Not all were built in the first version.
| State | Technician sees | Office sees |
|---|---|---|
| Upcoming | Job in today's list | Assigned, not started |
| Prepared | Items marked ready | Ready to go |
| Active | Job in progress | Technician on site |
| Completed | Form, edit, return stock | Record and report |
| Postponed | Moved off today | Needs a new date |
| Cancelled | Removed | Closed with reason |
| Needs attention | Flagged | Follow-up required |
ON THE WAY
- Running late
- Hours conflict
- Formula changed
- Missing item
ON SITE
- Customer unavailable
- Device unavailable
- Wrong device or site
- Needs more info
SYSTEM
- Visit postponed
- Poor connectivity
- Job changed after packing
17
From wireframes to UI
Structure first. Then the design system did the heavy lifting.
Everything started as greyscale wireframes: the technician app, the admin panel and the customer portal. I tested the flows at that level. Is the next task obvious? Can prep info be found from the job? Can status be read at a glance?
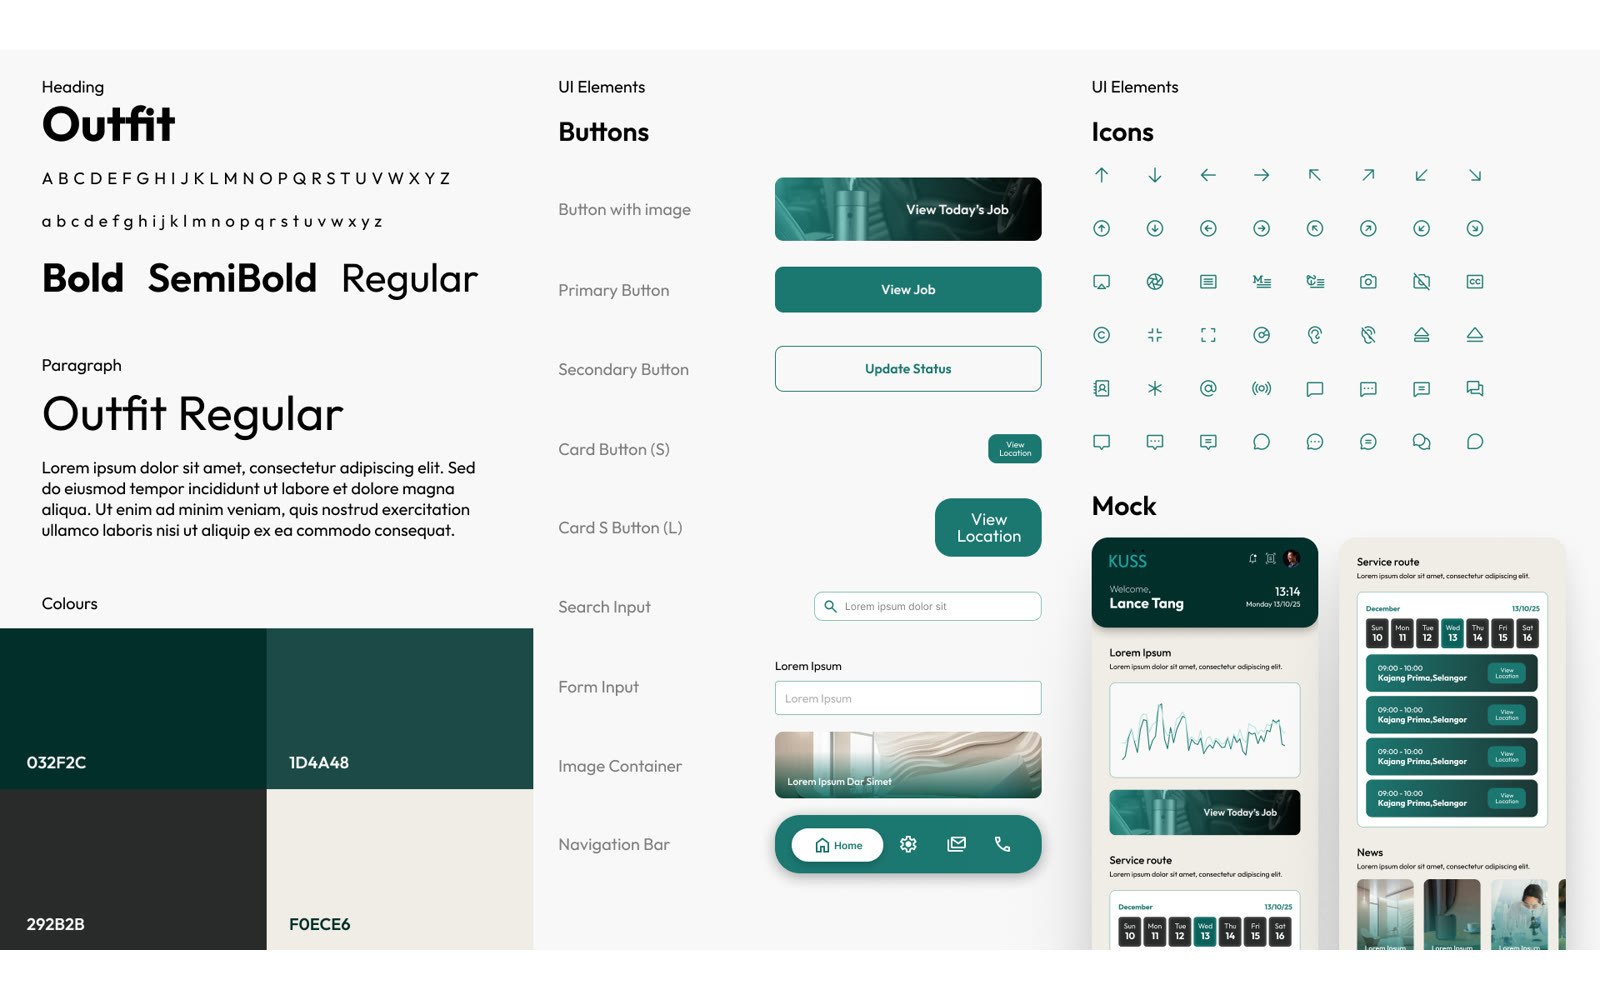
With three months and three products, I didn't draw every screen by hand. I built a base design system (Outfit, a dark teal palette, buttons, inputs, cards, a nav bar) and gave Claude the wireframes with that system. It generated the screens with the system applied, and I reviewed and refined each one. My time went into structure and decisions.
- Workflow
- IA
- Wireframes
- Design system
- Screens generated with Claude
- Review and refine
18
The admin panel
The technician app is one half. Admin is the control layer.
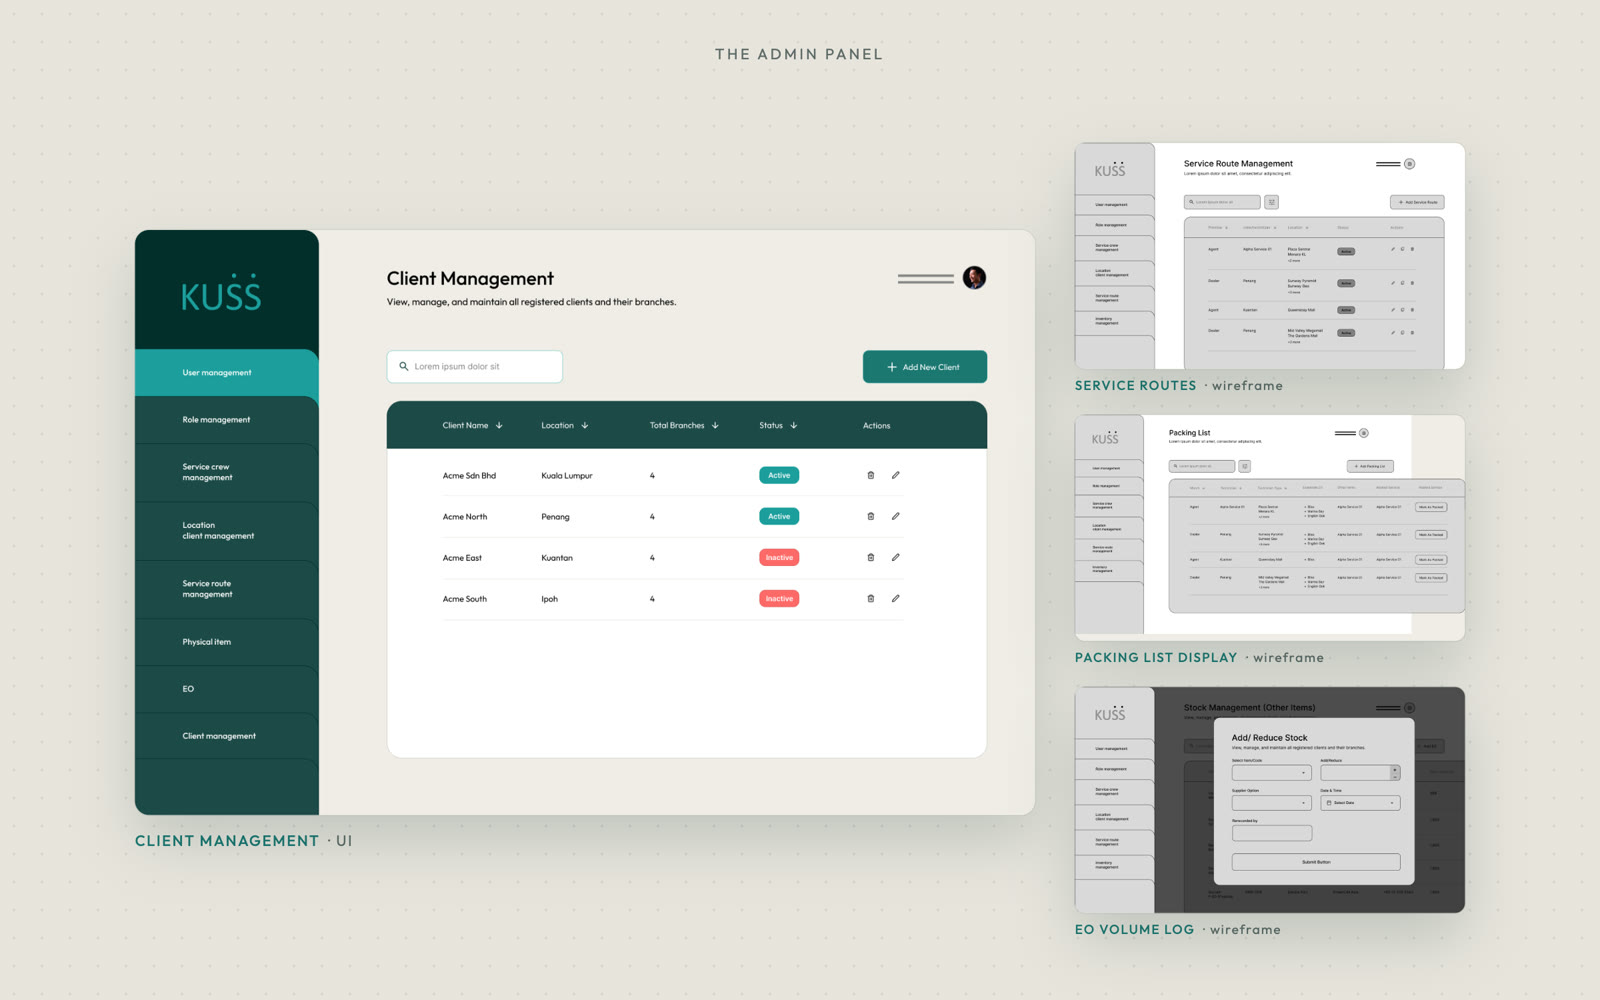
Admin is where users, crews, clients and branches, service routes, devices, stock, suppliers and news are managed. It also keeps an EO volume log of essential oil going out and coming back, so preparation and stock return close the loop.
- Admin plans the route
- Technician prepares and services
- System records
- Customer sees it
19
The customer portal
Same data, a much simpler view.
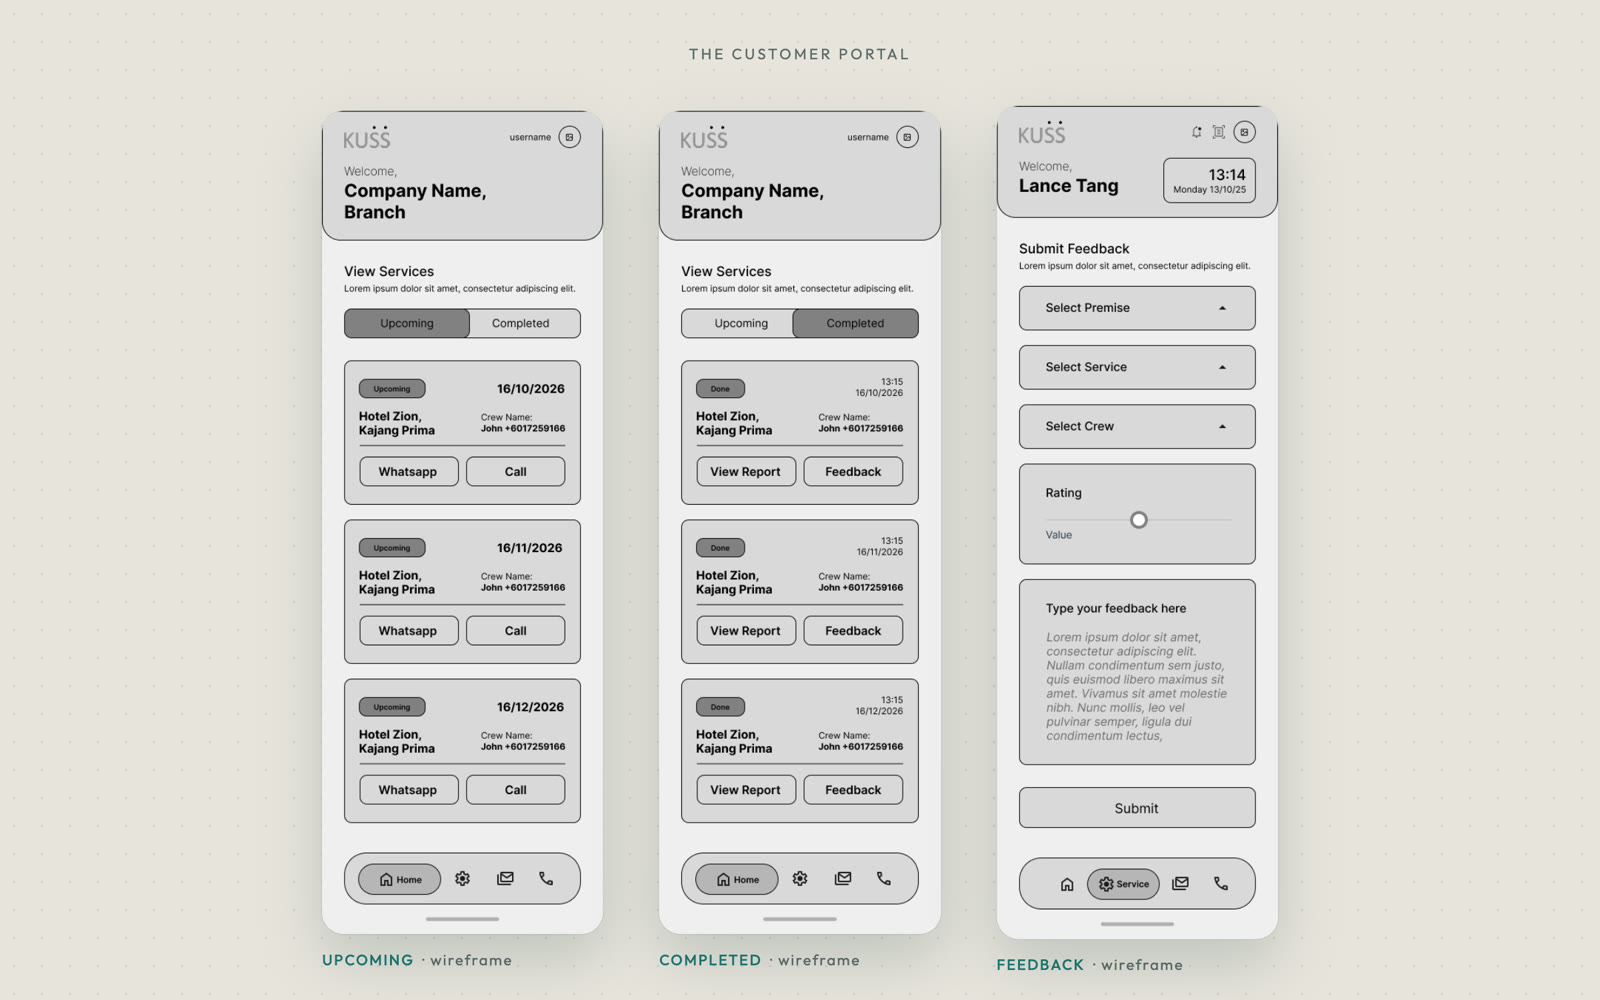
Customers see upcoming visits with the crew's name, WhatsApp and Call, completed visits with a report, and a feedback form to rate a visit. Every role reads the same records, so the portal is a filtered view, not a separate system.
20
Design system
A few objects repeat everywhere.
Jobs, sites, devices, statuses and preparation items show up across all three products. One set of components keeps them consistent, and it's what made the Claude-generated screens possible: the system was the brief.
21
Before and after
BEFORE
Spreadsheet-based planning
AFTER
A task-based day on Home
Start from what to do next, not from reading a schedule.
BEFORE
Information spread across sources
AFTER
The service task as the hub
Site, prep and device details all reached from the job.
BEFORE
Preparation checked by hand
AFTER
Preparation tied to each job
Formula and items come with the job, and unused stock comes back through Stock Return.
BEFORE
Status updated by hand
AFTER
A clear task lifecycle
The post service form closes the job, and the office and customer both see it.
22
Constraints
A process built in Excel
Kept its terms and logic recognisable, so it felt like an upgrade.
Three roles, one dataset
Pushed the design toward role-based views of the same records.
Field conditions
Phones, movement and weak signal shaped the hierarchy.
Three months
Why the design system and Claude workflow mattered.
23
Impact
What the system was designed to change.
This is design work for a system being built, so I'm not quoting performance numbers.
OPERATIONS
- Service info in one place
- Visible job status
- Stock and oil tracked out and back
- Less spreadsheet searching
TECHNICIANS
- Fewer places to check
- Clear priorities for the day
- Site context on hand
- Faster close-out with autofill
CUSTOMERS
- Upcoming and completed visits
- A report for each visit
- A direct line to give feedback
24
Outcome
From a spreadsheet of appointments to service as a connected lifecycle.
- Schedule
- Preparation
- Location
- Device
- Service
- Completion
- Stock return
- History
25
Reflection
Service design is system design
Each screen is one moment in an operational lifecycle.
The job is the unit of context
Making the task the centre stopped the hunting between sections.
Don't just digitise the sheet
Rebuilding Excel in an app would have kept the friction.
Design for the moment of use
Packing, driving and standing at a machine each need different things first.
Systems make AI useful
A clear design system turned Claude into a fast, consistent production step.
26
In short
I designed a field-service system for KUSS that turned a spreadsheet-driven workflow into a connected service experience, across a technician app, an admin panel and a customer portal.
| Role | Product designer |
| Scope | UX, information architecture, wireframes, UI, design system |
| Platform | Mobile app, admin panel, customer portal |
| Focus | Field service, B2B, operations |